
README.md 7.9 KB
Nine-day Continuous Recording of Mouse EEG under Chronic Sleep Restriction
https://gin.g-node.org/hiobeen/Mouse_EEG_ChronicSleepRestriction_Kim_et_al
1. Dataset introduction
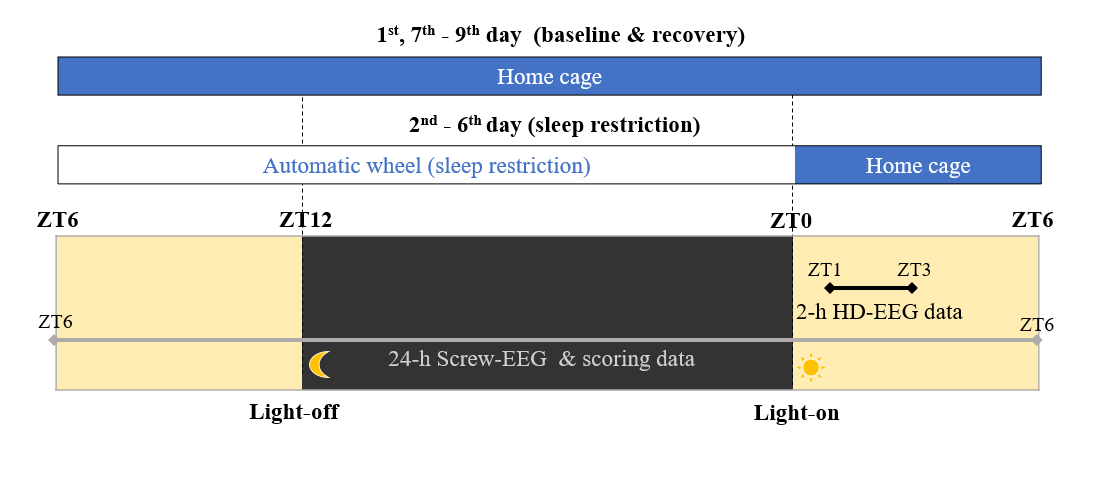
A set of screw and high-density (36 channel, intermittent 2-hour recordings) EEG (electroencephalogram) recording obtained from freely-moving mice (mus musculus) (n = 9). Details of experimental method are described in the original research articles using the same dataset.
Screw EEG: 2+1 channels (EEG & accelerometer): ceaseless 9-day recording (Total 9 mice, 9x24 hours per mouse).
High density EEG: 36 channels of EEG: intermittent 2-hour recordings (Total 9 mice, 2x).

Kim, B., Kocsis, B., Hwang, E., Kim, Y., Strecker, R. E., McCarley, R. W., & Choi, J. H. (2017). Differential modulation of global and local neural oscillations in REM sleep by homeostatic sleep regulation. Proceedings of the National Academy of Sciences, 114(9), E1727-E1736 [https://doi.org/10.1073/pnas.1615230114].
Kim, B., Hwang, E., Strecker, R. E., Choi, J. H., & Kim, Y. (2020). Differential modulation of NREM sleep regulation and EEG topography by chronic sleep restriction in mice. Scientific reports, 10(1), 1-13. [https://doi.org/10.1038/s41598-019-54790-y]
2. How to start
Dataset repository: https://gin.g-node.org/hiobeen/Mouse_EEG_ChronicSleepRestriction_Kim_et_al
Large dataset can be downloaded through gin-cli tool. After installation gin-cli[zz], run three commands below in your command line window.
 gin get hiobeen/Mouse_EEG_ChronicSleepRestriction_Kim_et_al
 cd Mouse_EEG_ChronicSleepRestriction_Kim_et_al/
 gin download --content
Reference: https://gin.g-node.org/G-Node/Info/wiki/GIN+CLI+Usage+Tutorial
3. Dataset handling
from matplotlib import pyplot as plt
plt.style.use('ggplot')
import numpy as np
from matplotlib.pyplot import plot, xlim, ylim, title, xlabel, ylabel, imshow
from scipy.io import loadmat, savemat

datafname = 'sampledata_spindle.mat'
d = loadmat( datafname )
data = d['data']
fs = d['fs'][0][0]
t = d['t'].reshape(-1)
""" Define handy functions """
from scipy import signal
from scipy.signal import butter, sosfiltfilt
from scipy.stats import pearsonr
from scipy.interpolate import interp1d
def fft_half(x, fs=500): return np.fft.fft(x.reshape(-1))[:int(len(x)/2)]/len(x), np.linspace(0,fs/2,int(len(x)/2))
def find(x): return np.argwhere( x.flatten() ).flatten()
def smooth(x, span): return np.convolve(x,np.ones(int(span))/int(span), mode='same')
def find_seg( ind ): # Handy function
  ind_diff = np.diff(np.concatenate((np.ones(1)*-1,ind),axis=0))
  discontinuous = np.where(ind_diff!=1)[0]
  data_seg = np.zeros((len(discontinuous)-1,2),dtype='int')
  for idx in range(len(discontinuous)-1): data_seg[idx,:]=[ind[discontinuous[idx]] ,ind[ discontinuous[idx+1]-1]]
  return data_seg
def bandpass_filt(x, band=(8,18), fs=500, order=10):
  if x.shape[0]>x.shape[1]: x=x.transpose()
  return sosfiltfilt(butter(order,[band[0]/(0.5*fs),band[1]/(0.5*fs)],btype='band',output='sos'),x).reshape(-1)
def get_upper_envelope(y, x, lower_limit = -10000000):
  peaks,_ = signal.find_peaks(y, height=lower_limit)
  peaks_x = np.concatenate((np.array([t[0]]),x[peaks],np.array([t[-1]])), axis=0)
  peaks_y = np.concatenate((np.array([y[0]]),y[peaks],np.array([y[-1]])), axis=0)
  return interp1d(peaks_x, peaks_y, kind = 'cubic')(np.linspace(peaks_x[0], peaks_x[-1], len(y)))
""" Spindle Detection Function """
def detect_spindle( data, fs=500 ):
    spindlef = bandpass_filt( data, band=(8,18), fs=fs )
    thr_updown = ( np.std(spindlef)*5, np.std(spindlef)*2 )
    thr_duration = 0.30 # sec
    thr_interval = 0.10 # sec
    hilb_amptd = np.abs( signal.hilbert( spindlef ))
    amptd_envelop = smooth( hilb_amptd, fs/5 )
    big_enough = find(amptd_envelop>thr_updown[1])
    idx_merged = np.array([])
    if len(big_enough)>0:
        # Duration Thresholding
        start_end = find_seg( big_enough )
        long_enough = start_end[find( (start_end[:,1]-start_end[:,0])>(thr_duration*fs)),:]
        # Amplitude Thresholding
        include_flag = []
        for i in range(long_enough.shape[0]):
          data_to_inspect = data[range(long_enough[i,0],long_enough[i,1])]
          if len( find(data_to_inspect>thr_updown[0]))==0:
            include_flag.append(i)
        strong_enough = long_enough[include_flag,:]
        # Merging short interval events
        idx_merged = strong_enough.copy()
        interval = strong_enough[1:,0] - strong_enough[0:-1,1]
        id_to_merge = find(interval < thr_interval*fs)
        for j in range(len(id_to_merge))[::-1]:
          idx_merged[id_to_merge[j],1]= idx_merged[id_to_merge[j]+1,1]
          idx_merged = np.delete(idx_merged, id_to_merge[j]+1,axis=0)
    return idx_merged, amptd_envelop
""" Visualization: Spindle """
spindle_idx, amptd_envelop = detect_spindle( data, fs )

plt.figure(1, figsize=(15,10) )
plot( t, data, 'k' )
ylim((-1000, 1000))
for ii in range(spindle_idx.shape[0]):
    plot( t[spindle_idx[ii,0]:spindle_idx[ii,1]], data[spindle_idx[ii,0]:spindle_idx[ii,1]], 'r' )
#xlim((5,15))

plt.subplot(3,1,2)
plot( t, amptd_envelop, 'k' )
for ii in range(spindle_idx.shape[0]):
    plot( t[spindle_idx[ii,0]:spindle_idx[ii,1]], amptd_envelop[spindle_idx[ii,0]:spindle_idx[ii,1]], 'r' )
#xlim((5,15))

""" SWA Detection """
def detect_swa(data, fs=fs, t=t, shift_band = (.05, 6),
               thr_duration = (0.12, 0.70), thr_std = 1, thr_xcorr = 0.7):

  # Data filtering & downshifting
  data_filt = bandpass_filt(data,shift_band,fs)
  data_shift =data.reshape(-1) - get_upper_envelope(data_filt,t)
  std_data = np.std( data_shift )

  # Get upper/lower indeces near zero
  cross_negative = np.insert( find( data_shift<0 ), 0,0)
  cross_positive = find( data_shift>=0 )
  ups = cross_negative[ find(np.diff(cross_negative)>1) ]+1
  downs = cross_positive[ find(np.diff(cross_positive)>1) ]
  if downs[0] < ups[0]:
    min_length = min(downs.shape[0], ups.shape[0]);
    updowns=np.array( [list(downs),list(ups) ])
  else:
    min_length = min(downs.shape[0], ups.shape[0]-1);
    updowns=np.array( [downs[0:min_length-1],ups[1:min_length] ])

  # Main inspection loop
  result = []
  for j in range(min_length-1):
    data_piece = data_shift[updowns[0][j]:updowns[1][j]]
    min_where = np.argmin(data_piece)
    n =len(data_piece)

    # Rejection criteria
    flag_long = n < (thr_duration[0]*fs)
    flag_short = n >= (thr_duration[1]*fs)
    flag_amptd = np.max(np.abs(data_piece)) < (std_data*thr_std)
    shift_squared = np.diff(data_filt[updowns[0][j]:updowns[1][j]-1])*np.diff(data_filt[updowns[0][j]+1:updowns[1][j]])
    n_inflection = find(shift_squared<0).shape[0]
    flag_inflection = n_inflection>2
    reject = flag_long | flag_short | flag_amptd | flag_inflection

    # Calculate correlation coefficient
    if not reject:
      min_where = np.argmin(data_piece)
      templateL = np.arange(0,min_where) / (min_where-1)
      templateR = np.arange(0,n-min_where)[::-1] / (n-min_where)
      template = np.concatenate((templateL,templateR),axis=0)*np.min(data_piece)
      template[find(np.isnan(template))]=0

      r, _ = pearsonr( template, data_piece )
      if r > thr_xcorr:
        result.append([updowns[0][j],updowns[1][j]])
  print('[SWA detection] %d events are detected'%len(result))
  return np.array(result, dtype=int)
""" Visualization: SWA """
swa_idx = detect_swa(data, fs=fs, t=t)
plt.figure(1, figsize=(15,10) )
plt.subplot(3,1,1)
plot( t, data, 'k' )
ylim((-1000, 1000))
for ii in range(swa_idx.shape[0]):
    plot( t[swa_idx[ii,0]:swa_idx[ii,1]], data[swa_idx[ii,0]:swa_idx[ii,1]], 'r' )
[SWA detection] 128 events are detected
