Analysis methods
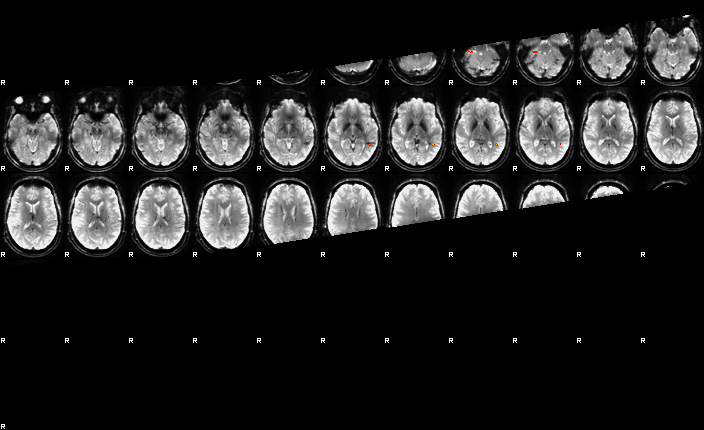
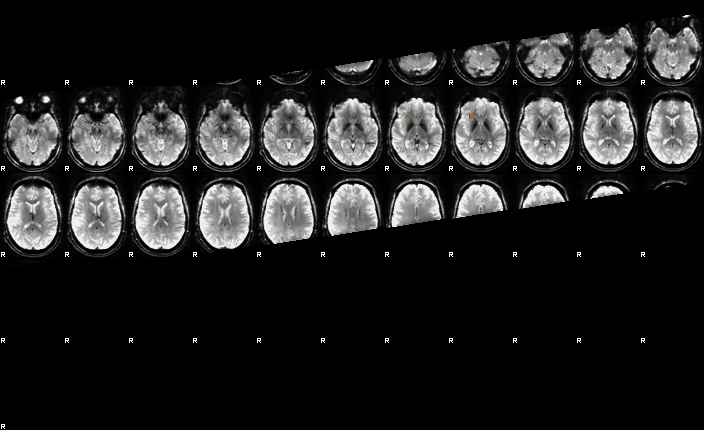
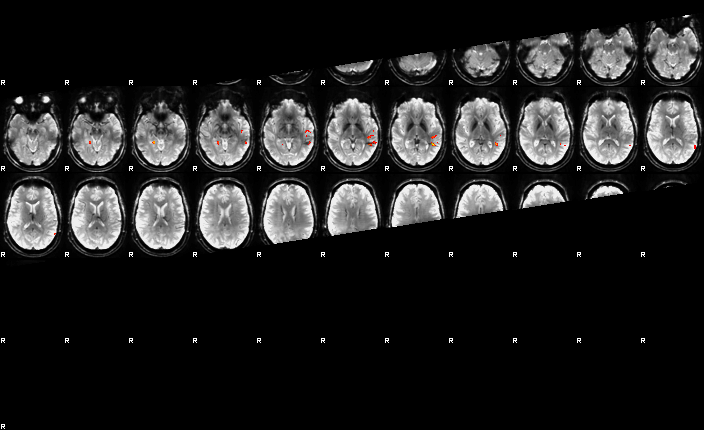
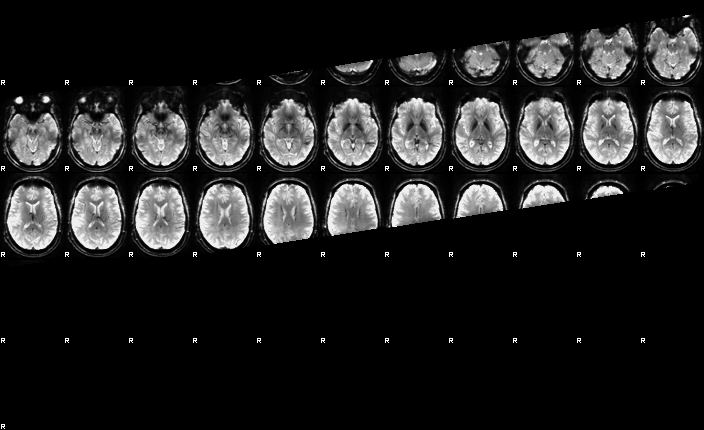
FMRI data processing was carried out using FEAT (FMRI Expert Analysis Tool) Version 6.00, part of FSL (FMRIB's Software Library, www.fmrib.ox.ac.uk/fsl). Z (Gaussianised T/F) statistic images were thresholded using clusters determined by Z>3.4 and a (corrected) cluster significance threshold of P=0.05 [Worsley 2001].
References
[Worsley 2001] K.J. Worsley. Statistical analysis of activation images. Ch 14, in Functional MRI: An Introduction to Methods,
eds. P. Jezzard, P.M. Matthews and S.M. Smith. OUP, 2001.
 5.5
5.5
zstat1 - C1 (geo, groom > non_geo)
zstat2 - C2 (geo, groom, se_new > non_geo)

zstat3 - C3 (geo, groom, se_new, se_old > non_geo)

zstat4 - C4 (geo > non_geo)

zstat5 - C5 (groom > non_geo)
zstat6 - C6 (se_new > non_geo)

zstat7 - C7 (se_new, se_old > non_geo)

zstat8 - C8 (se_new > se_old)

zstat9 - C9 (av: se_new > pe_old)
zstat10 - C10 (av: se_new, pe_new > se_old, pe_old)

zstat11 - C11 (av: se_new > se_old)
zstat12 - C12 (av: se_new > se_old, pe_old)

zstat13 - C13 (av: se_new, pe_new > pe_old)